Reports
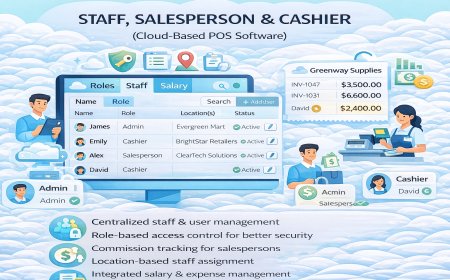
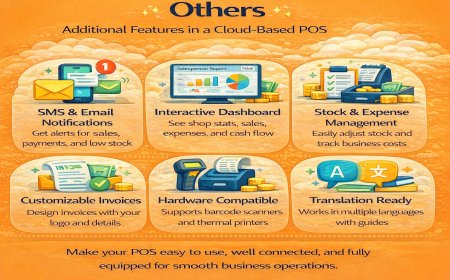
Use cloud POS reports to monitor sales trends, stock levels, expenses, taxes, cash registers, and staff performance from anywhere, anytime.
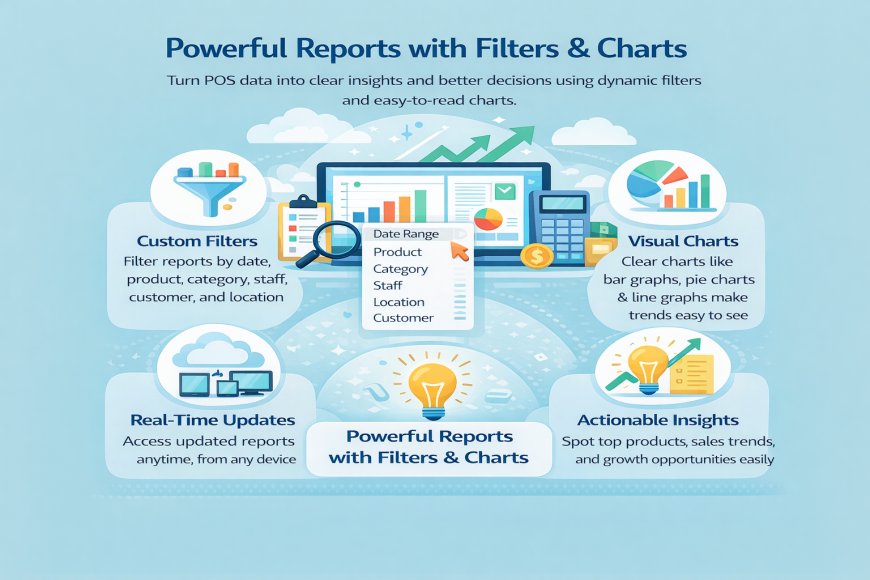
2. Powerful Reports with Filters & Charts
In a cloud-based POS, powerful reports with filters and charts help you understand your business data quickly and clearly, without technical knowledge. Instead of looking at long tables or raw numbers, the system presents your data in simple visual charts that are easy to read and understand.
With smart filters, you can view reports by date range, product, category, staff, customer, or business location. This means you can focus only on the information that matters to you at any moment, whether you want to check today’s sales, last month’s profit, or performance by a specific cashier.
The charts and graphs make trends obvious at a glance. You can easily spot best-selling products, slow sales periods, rising expenses, or stock movement patterns. This helps you make faster and better business decisions without guesswork.
Because the POS is cloud-based, these reports update in real time and can be accessed from any device — phone, tablet, or computer — wherever you are.
What's Your Reaction?
 Like
0
Like
0
 Dislike
0
Dislike
0
 Love
0
Love
0
 Funny
0
Funny
0
 Angry
0
Angry
0
 Sad
0
Sad
0
 Wow
0
Wow
0